Alien Enemies in 1942
In early 1942, the body of strawberry farmer Tadeo Suzuki is found on the rocks beneath the Bluff near San Ignacio, California, his clothes drenched in alcohol, a flashlight nearby.
Police are unsympathetic investigators. Suzuki was probably a spy, wasn’t he? Isn’t that why Japanese, many of whom American citizens, are being rounded up, their land and possessions confiscated, they and their families sent to internment camps hundreds of miles away?
In The Cry of Cicadas, latest in the Max Byrns detective mysteries series, author J. Stanley Jones intersperses the rising hostility against and suspicion of Japanese citizens within Byrns’ step-by-step investigative police procedurals as he, wife Elizabeth, and son Philip, on leave from the U.S. military, move from situation to situation and suspect to suspect to find Tadeo’s killer. In less than two months after the attack on Pearl Harbor, residents of San Ignacio are openly fearful that “the enemy is loose all around us” and that their Japanese neighbors are a danger to national security. Assaults and beatings soon follow, leaving one unconscious man with a sign on his chest: “Go Home, Japs.” (For this author’s review of the novel, see: https://historicalnovelsociety.org/reviews/the-cry-of-cicadas-a-byrns-on-the-homefront-mystery/)
President Franklin D. Roosevelt has already taken steps against possible enemies who may be living in the US. On December 7, 1941, he issued Presidential Proclamation 2525, authorizing the US government to “apprehend, restrain, secure, and remove natives, citizens, denizens, or subjects of the hostile nation of Japan as alien enemies.” (https://www.presidency.ucsb.edu/documents/proclamation-2525-alien-enemies-japanese)
The following day, he issued two other proclamations—2526 and 2527—for Germans and Italians living in the US. (https://www.ebsco.com/research-starters/history/analysis-presidential-proclamation-2526-alien-enemies-germans; https://www.nationalww2museum.org/war/articles/proclamation-2527-internment-italian-americans)
Executive Order 9066 came next, the order that led to mass apprehension and internment of Japanese Americans living on the West Coast.
The proclamations and Executive Order issued by Franklin Roosevelt were offshoots of the Alien Enemies Act, the law enacted in 1798 that gives US presidents the power to apprehend, detain, and deport individuals from foreign nations considered to be hostile to America at a time of war or invasion. The act has been invoked only three times in American history—during the War of 1812 with Great Britain, World War I, and World War II.
The Alien Enemies Act is controversial today because it is being cited as the basis for President Donald Trump’s executive orders that categorize drug cartels as foreign terrorist organizations and allow law enforcement to apprehend, detain, and deport individuals labeled as members of those cartels. The Alien Enemies Act is being used by Trump and his administration in the absence of an actual declaration of war or invasion by a hostile foreign nation. Law enforcement is using the law to deny due process, a core tenet of the US Constitution, and stop detainees from being able to respond to charges, mount a defense, and seek redress in a court of law.
This Time Stamp post describes use of the Alien Enemies Act in the 1940s against Japanese Americans.
THE ENEMY ALIEN CONTROL PROGRAM
Immediately after the release of Proclamations 2525, 2526, and 2527 in 1941, the FBI and other law enforcement agencies began arresting suspected enemy aliens of German, Italian, and Japanese ancestry. The Justice Department processed each case before a local alien enemy hearing board and released or pardoned many who had no clear ties to enemy governments or actions. Others, often with little more than unsubstantiated accusations or weak evidence, were sent to Immigration and Naturalization Services’ internment camps, where some were held for the duration of the war and beyond. (Overview of the Enemy Alien Control Program)
EXECUTIVE ORDER 9066
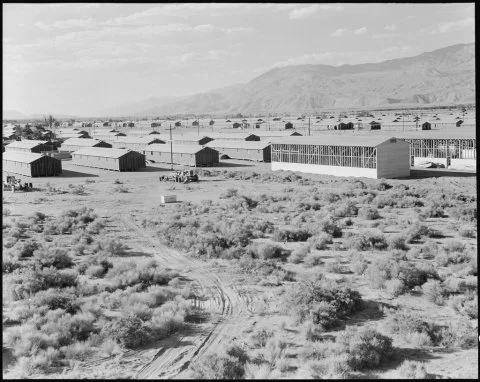
Then, on February 19, 1942, President Roosevelt signed Executive Order 9066. This order classified the West Coast of California as a war zone from which “any and all persons could be excluded,” and it triggered the mass relocation of more than 11,000 Japanese residents and internment in Manzanar, a 5500-acre agricultural and housing camp between the Sierra Nevada and Inyo mountain ranges of Owens Valley. (Overview of the World War II Enemy Alien Control Program)
The US War Department also considered expelling ethnic Germans and Italians from coastal areas but did not do so because of the large number of individuals involved, more than 11 million people were German born themselves or one or both parents were German. Twelve thousand German Americans nevertheless were interned some time during the course of the war. (German American Internment) Hundreds of Italian Americans were sent to internment camps, and more than 10,000 were forced from their homes, their possessions confiscated, and hundreds of thousands were under surveillance or curfew. (https://www.history.com/articles/italian-american-internment-persecution-wwii)
Internment
Within days of signing Executive Order 9066, Japanese Americans were ordered to prepare for their removal from California: pack up whatever belongings they could carry themselves, then store, sell, or give the rest to friends or family. The result for Japanese business owners was full liquidation of business inventory. For Japanese farmers, it meant sale or leasing of their farmland for pennies on the dollar or outright abandonment. For all Japanese, it meant reporting for incarceration in the next seven to 10 days. (https://www.history.com/this-day-in-history/july-26/united-states-freezes-japanese-assets)
Members of each family received an identification number before being loaded into buses, cars, trains, or trucks and transported under military guard to an assembly center where they waited until their new lodgings were completed. For Japanese Americans in California, that was Manzanar. (https://www.history.com/this-day-in-history/july-26/united-states-freezes-japanese-assets)
https://ddr.densho.org/ddr-densho-151-64/
Over 500 acres, 504 barracks were organized into 36 blocks. The entire Manzanar complex was surrounded by barbed wire with eight guard towers mounted by searchlights and patrolled by military police. Two hundred to 400 hundred people lived in each block. Each barrack had four rooms, open men’s and women’s toilets and showers, a laundry, and mess hall. Rooms had a single hanging light bulb for illumination, an oil heating stove, and each resident was given a cot, straw mattress, and blanket. (Life at Manzanar, Japanese American Confinement Sites Consortium, JACSC)
Until the final internee was released in 1945, residents tended agricultural fields, raised cattle, chickens, and hogs, made clothes and furniture for themselves and camouflage netting and experimental rubber for the military. On their own, managers of barracks blocks established churches and temples and clubs for boys and girls, developed dance, music, sports, and other recreational programs, created gardens and ponds, and published their own newspaper. (JACSC)
Spies?
Mass incarceration was justified at the time because of fears that Japanese residents were spying on military targets. Yet the 1983 Commission on Wartime Relocation and Internment of Civilians found that there was no “military necessity” for internment. It was caused instead by “race prejudice, war hysteria, and a failure of political leadership.”
Critics accused the commission of ignoring reports of a growing number of Japanese-American spies revealed in secret coded messages that were declassified in 1978—the so-called MAGIC intercepts.
MAGIC was the code name for a collection of 4000 diplomatic messages between the Japanese government in Tokyo and Japanese embassies and consulates that were intercepted, decoded, and given to US cabinet and military leaders in early 1941. One cable in May, 1941, reported plans to keep close watch on airplane manufacturing plants and military establishments and claimed to have reliable espionage contacts in San Pedro and San Diego. (U.S. knew of Japanese-American spies, Washington Times, May 31, 1983)
Analysts and historians dismiss the notion of a large-scale espionage effort along the West Coast, noting that the MAGIC cables were more wishful thinking than an actual intelligence operation. (One cable, for instance, acknowledged “we are doing everything in our power to establish outside contacts in our efforts to gather intelligence material,” and it expressed concern about “Japanese persons whom we can’t trust completely.” (Brian Niiya, Magic cables, Densho)
Submarines?
Fears of Japanese residents as spies were fueled by a number of submarine sightings and attacks in the months after Pearl Harbor. Nine Japanese submarines gathered along the San Francisco coast in late December, 1941, with the aim of attacking the city beginning on Christmas Day. But the attack never happened. It was initially postponed until December 27, then called off completely because the submarines were critically short of fuel. (Steven D. Lutz: Target: American’s West Coast)
The freighter Absaroka was torpedoed by a Japanese sub near Los Angeles on Christmas Eve, 1941, but the ship was not sunk, and almost all crew members were rescued. The Ellwood Richfield Oil Company refinery and storage facility in Redondo Beach was bombarded by a Japanese submarine on February 23, 1942, but most of the shells missed their target or landed as duds.
Early the next morning, the San Pedro Naval Operations Base sent three planes and two destroyers and dropped depth charges into the sea near Point Vincente. Air raid wardens ordered people to take shelter and douse lights while shrapnel fell onto homes and autos in Santa Monica and Long Beach. The impetus? Nothing more than a runaway weather balloon. (Steven D. Lutz: Target: America’s West Coast)
Reports that freighters had been sunk and attacks had been made on oilfields, cities, and towns were no more than flights of fancy. “In the end, Japan never had the time, opportunity, or resources to launch a major offensive effort against the continental United States. (Lutz: Target American’s West Coast)
Next time on Time Stamp: Japanese Americans after the war, the long road to reparations.
Sources:
https://www.warhistoryonline.com/instant-articles/internment-of-germans.html
https://en.wikipedia.org/wiki/Internment_of_German_Americans
(https://www.history.com/this-day-in-history/july-26/united-states-freezes-japanese-assets
https://encyclopedia.densho.org/Magic_cables/
https://warfarehistorynetwork.com/article/target-americas-west-coast/
(https://www.presidency.ucsb.edu/documents/proclamation-2525-alien-enemies-japanese)
(https://www.ebsco.com/research-starters/history/analysis-presidential-proclamation-2526-alien-enemies-germans; https://www.nationalww2museum.org/war/articles/proclamation-2527-internment-italian-americans)
https://www.archives.gov/milestone-documents/executive-order-9066
https://en.wikipedia.org/wiki/Commission_on_Wartime_Relocation_and_Internment_of_Civilians

